SwiftAuto Traders – Sales & Profit Analysis
Overview
The goal was to evaluate dealership performance using sales and profit data, and present insights through charts and dashboards.
Part 1 – Excel Visualization
I explored dealership trends and profitability by creating the following visualizations in Excel:
- Bar Chart: Quantity Sold by Dealer ID (sorted)
- Line Chart: Profit by Date and Model
- Column Chart: Profit by Year and Dealer ID
- Line Chart: Sum of Profits for Hudson model by Dealer ID
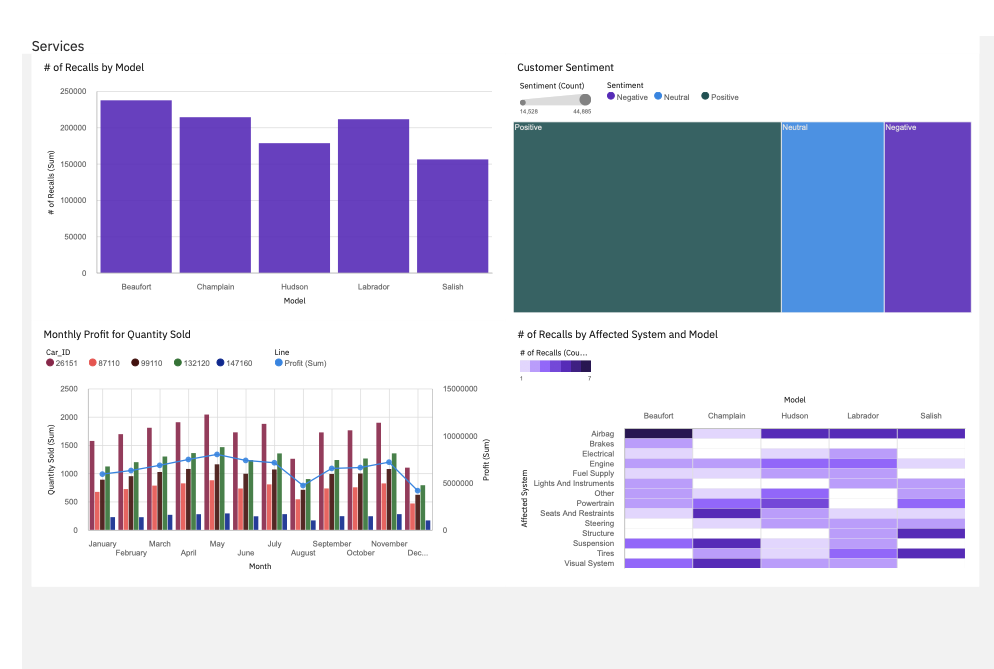
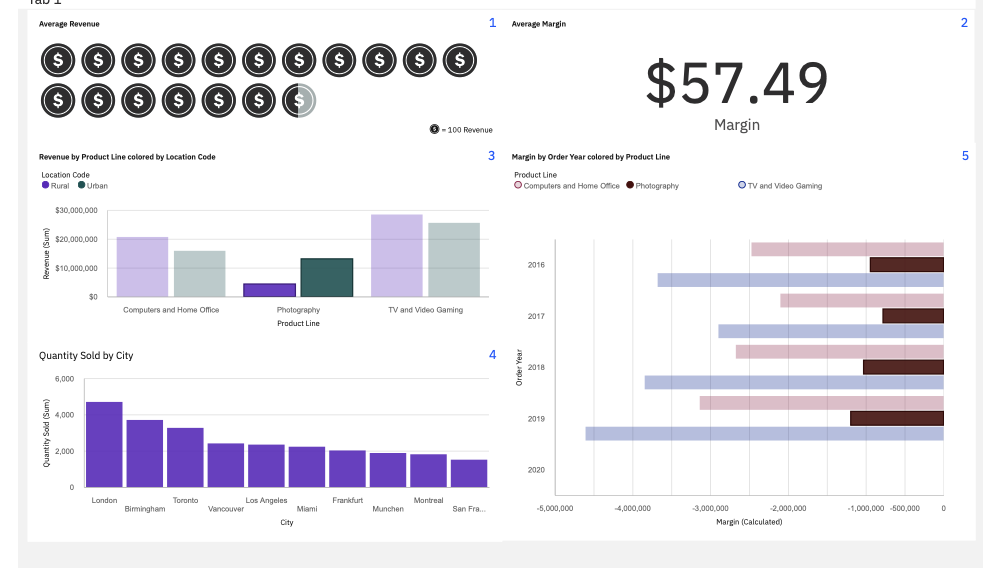
Part 2 – Dashboard Design
Created an interactive dashboard using Cognos Analytics (or Looker Studio) with two focused report pages: Sales and Service.
Key Outcomes
-
Turned Raw Sales Data into Insightful Visuals
-
Created Business-Ready Dashboards
-
Practiced BI Skills with Excel and Cognos/Looker Studio